There is no doubt that a successful Data Scientist must be proficient in programming, modeling, and data munging (extracting, cleaning, and feature engineering data). However, there is another key skill that is often overlooked: the ability to communicate findings clearly and effectively. If you as a Data Scientist cannot motivate the business buy-in to effect change, your powerful model will collect dust on a shelf. Stakeholders will only trust your model if they understand the value it adds, what has been done to create it, and why it works. They should not be left to trust you and your “black box” blindly. The solution is data storytelling: using the power of narrative to communicate your findings in a way that resonates with your stakeholders. Doing this combines your data science expertise with intuitive visualizations and—most importantly—a story to connect the dots.
Data storytelling frequently employs data visualizations, but it involves much more than presenting a graph. Data visualization is often static: a chart may represent a single facet of the data, or layers of features for a more complex concept. Or, it can be an interactive dashboard where the viewer is free to experiment with different scenarios and reach their own conclusions. Data storytelling takes these ideas a step further. It guides the viewer through the process of formulating a question and leads them towards the desired conclusion in a step-by-step fashion. In short, it takes the viewer on a journey through the data. This difference between data visualization and data storytelling is captured in Moritz Stefaner’s analogy comparing data visualization to portraits:
“[Data] can reveal stories, help us tell stories, but they are neither the story itself nor the storyteller. Portraits have no story to them either. Like a photo portrait of a person, a visualization portrait of a data set can allow you to capture many facets of a bigger whole, but there is not a single story there, either.” [1]
Data storytelling marries data visualization with a guided narrative. It pairs the data and the graphics with words, not only describing what can be seen in the image, but telling a story to lead you through the analysis process. A narrative “is the way we simplify and make sense of a complex world,” [2] and data is certainly a complex world to understand.
So then, what does good storytelling entail?
First and foremost, it involves a good story – one focused on a very clear “data ask,” much like a thesis statement in a paper. Let this ask lead the direction of the story in the same way it leads your work as a Data Scientist. Be careful to remove the extraneous tangents encountered along the way and summarize your ask to avoid the complex details of the analytics.
The arc of a good story includes an exposition, rising action, climax, falling action, and conclusion. The exposition is the setting of the data stage; what is the universe of data being examined? The rising action explores the data, building up to the questions and feeding the viewer the data ask. Your questions can include: What is happening? To whom? Where? When? and Why/How? The climax will be the pivotal discovery in the data that makes it possible to answer these questions, and the falling action is the ultimate answer. Lastly, and most importantly, comes the conclusion: what is the one thing you want the viewer to leave with? To keep the story cohesive, the whole story should build up to and support this conclusion—anything extraneous should be stripped away.
Additionally, if it is relevant to the data at hand, create a character to follow through this process. Follow what their experience would be like in the data. For instance, if dealing with churn, create a customer and follow their path; point out this character’s possible motivations (since they are the problem to solve), present the action that could be taken by the company, and show how that company’s action impacts the character’s probability of staying with the company. Creating a character can make it easier to follow the narrative as viewers imagine themselves in this role. William Proffitt’s blog post “Taking Action on Technical Success: A Fable of Data Science and Consequences” is a good example of using a character to illustrate your data story.
Because data storytelling builds on data visualization, excellent visualizations are essential. They are the foundation to data storytelling; without strong data visualizations to support your story, it will crumble. This foundation includes more than just making sure parts are labeled correctly; you also need to choose the best visualization for the task, avoid cluttering the graph, and ensure that your figure tells a truthful story.
The first step is picking the right visualization form for the job. This should be led by the data ask and the conclusion. Are you showing differences over time, differences between categories, or differences based on location? Variations of line graphs are good for showing changes over time because they connect the dots and illustrate the peaks, falls, and growth rate (or lack thereof). If you are wanting to compare distinct categories, this is often done with bar graphs or any other graph that shows size and proportionality. If geographic location is important, it is a good idea to actually visualize these locations with a map (Figure 1). Additionally, if your story involves comparing entities, ensure that the structure of your graph allows for them to be easily compared (Figure 2). These are some of the basic types of visualizations, but they can be combined or enhanced to show more detailed and complex points.

Figure 1. A map showing the dispersion of individuals impacted by Hurricane Katrina. This shows the relative distance that people have traveled, and also uses the size of points to illustrate the volume of individuals in a location. [3]


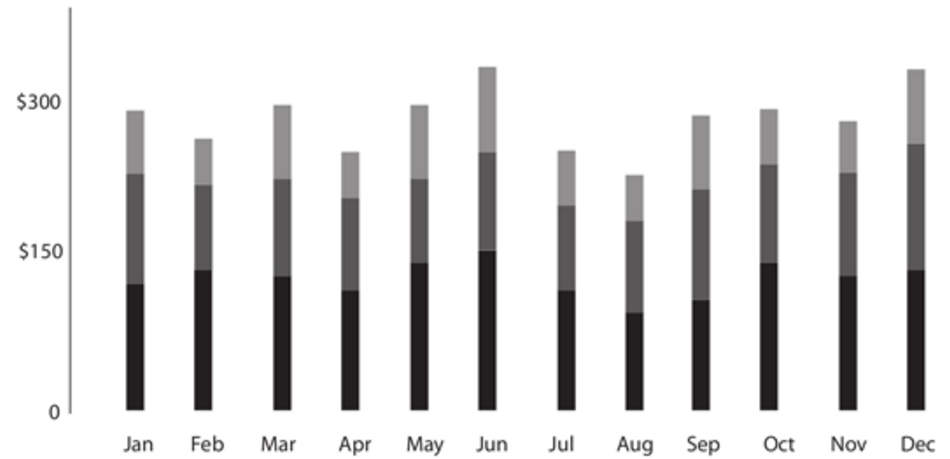
Figure 2. These graphs show a company’s sales across the different months in its different locations (shading of bars). The first graph focuses on answering the question of which locations have the better sales and when. The second graph focuses more on which months overall the company has better sales. [4]

Figure 3. Bar graph from the White House showing how graduation rates have changed since President Obama has been in office [5]

Figure 4. Bar graph from Figure 3 adjusted to have the Y axis start at zero [5]

Figure 5. Line graph showing graduation rates from 1975-2012 [5]

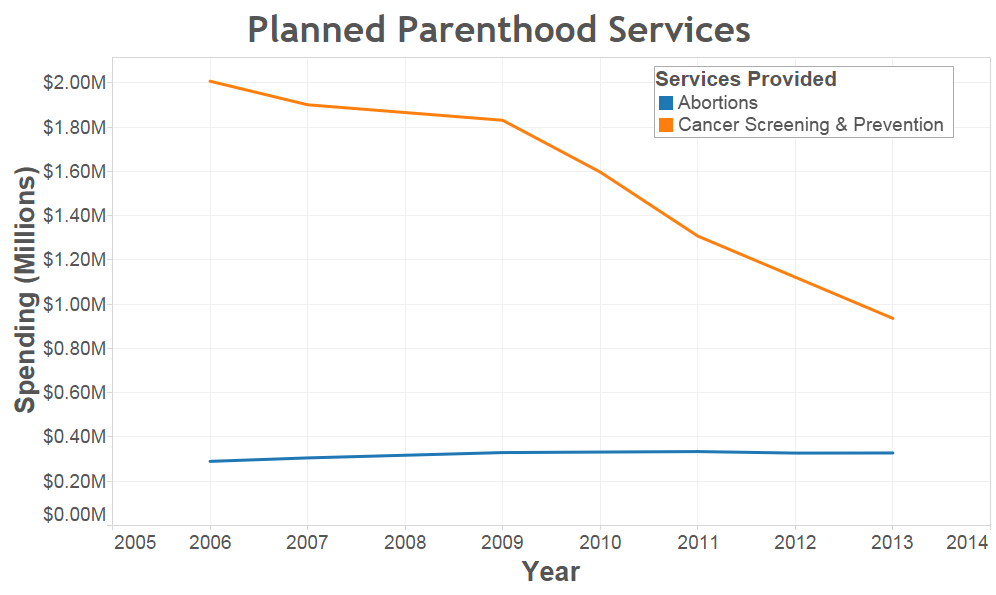
Figure 6. Chart created by Americans United for Life illustrating changes in spending on abortion services and cancer screenings and prevention. [5]
Figure 6 is a line graph from Americans United for Life that intends to show that abortion spending by Planned Parenthood has increased while the spending for cancer screening and prevention has decreased. One flaw with this graph is that the lines each only connect two data points: spending from 2006 and spending from 2013. A line graph is intended to show continuous data, which would reveal rates and timing of change in the data as well. While this graph successfully shows increases and decreases in spending for each service, it visually implies that these changes are equivalent in value. This misperception is caused by putting each item’s spending on different scales, which also makes it appear as if spending for cancer screenings has dropped below the total amount spent on abortions. This graph is essentially a dual-axes graph (without labeled axes), and those are advised against.

Option A (above) and Option B (below)

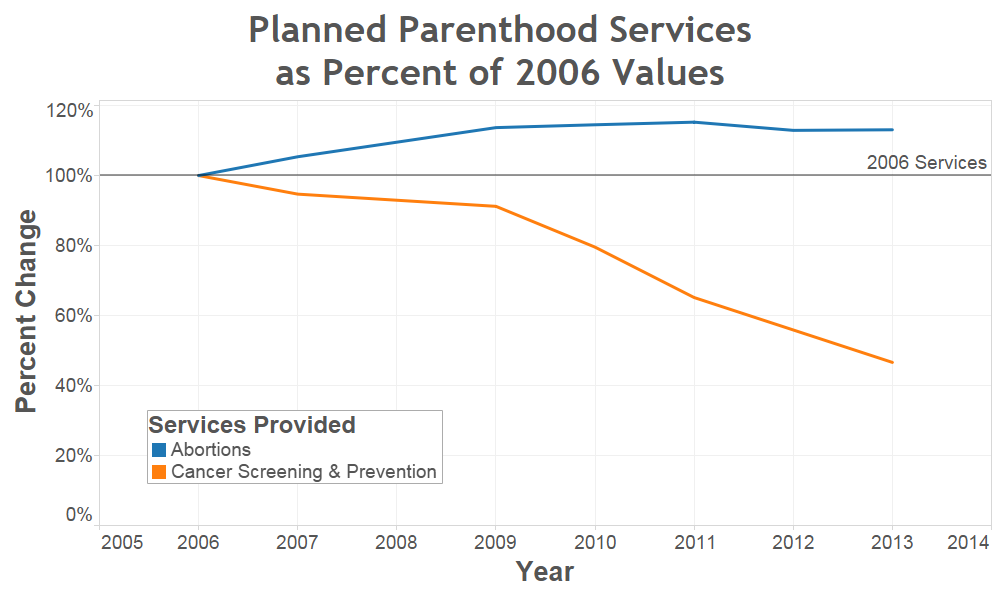
Figure 7. Alternative improvements to plotting the information from Figure 6
Finding the missing data, and creating a line graph with a single Y-axis (Figure 7) improves the presentation. Which graph is “better” depends on the story you wish to tell. Option A better reveals the relative expenditures; it shows that, though cancer screening spending has been cut in half in the seven years, it still is much higher than abortion spending. On this absolute scale, the rise in abortion service spending—the intended story of the original graph’s author—is not evident in option A. Option B makes the spending changes within each channel evident by making the y-axis represent the percent change since 2006. It reveals that abortion spending has increased, and allows you to compare that percent increase to cancer screening’s percent decrease. What option B lacks is a comparison of what the absolute spending is for each service, which could be alleviated by marking those values on the graph. A comprehensive story then, might first show option A to give the viewer an idea of scale before presenting option B, showing relative changes.

Figure 8. The image on the left is the original chart presented in a Vox Media article, while the one on right has adjusted the sizing of the circles [6]
Lastly, once you have chosen the right graph to represent your data, a good visualization should not be cluttered. Only add to the visualization what needs to be there to tell the story. With data storytelling, this often means that the visualization should take up the majority of the space. You can add words to the image to guide the story, but they should be succinct and focused on ensuring that the viewer is taking away the important points. Let the visualization do most of the talking.
To allow the visualizations their deserved attention, the narrative should be easy to follow and not require complex explanations. If a single visualization has too many facets for it to be quickly and easily interpreted, break it down and build it up in layers. Start with the basic concept of the visualization, and then slowly add the layers to the graphic as you delve further into the question or problem at hand. The building of these layers makes the story easier to digest.
Some great examples of strong data story telling are exhibited by Tampa Bay Times “Why Pinellas County is the worst place in Florida to be black and go to public school,” the R2D3 “Visual Introduction to Machine Learning,” and Hans Rosling’s Ted Talk “The Best Stats You’ve Ever Seen.”
The Tampa Bay Times example demonstrates the power of using minimal text with the graphic and building up the story in layers. Its images are telling the story, and the words are there just to make sure the viewer is on the right track. Text never takes up more than two sentences’ worth of space at a time. This example builds its layers by first orienting the focus (Pinellas County and its schools), and then adds in the other schools for reference. The gradual steps in this story make it successful.
The R2D3 example focuses less on telling the story of its data, and more on telling the story of how a machine learning process works using the data as the “character” to follow. It presents the problem of needing to classify New York or San Francisco homes, builds up the addition of multiple variables for classification, and then shows how the method’s resulting accuracy is achieved. This concept can be exceptionally useful when needing to convince a stakeholder of how or why a given method works.
Another positive feature of the Tampa Bay Times article and the R2D3 story is that they both rely on computer scrolls to lead through the story instead of forcing the viewer to click on small parts like a dashboard might. This feature makes them more mobile user friendly, which is especially important in the current age. It also makes the stories more adaptable to print, and it is easy for readers’ eyes to scroll through them.
The words presented with great data storytelling don’t always have to be printed. The concept of data storytelling carries over to the words spoken in a presentation, which is phenomenally exemplified by Hans Rosling’s Ted Talk. Rosling uses the added elements of his tone and pacing to build up the story, and he personifies the different countries as characters to follow and root for. Rosling also actively talks the audience through the visualization’s progression the same way the other storytelling examples added text to advance their stories.
Most importantly, when attempting data storytelling, remember that “whatever data we work with, when we share our insights, our goal is to move people to see things they haven’t seen before.” [2] Let me emphasize the word “move”; you want to engage the viewer in asking questions about what comes next through the building of the story. By telling a clear, cohesive, and interesting story with your data, stakeholders are given the opportunity to understand and trust your methods, and thus it becomes much easier to encourage actions based on the data’s insights.
Previously published on Predictive Analytics Times.

